
Published: June 11, 2019 7:25 pm est

by Harish Shahi,
Contributor Commodities Market Analyst
NewsmovesMarketsForex
Crude Oil Daily Chart Analyst June 19, 2019
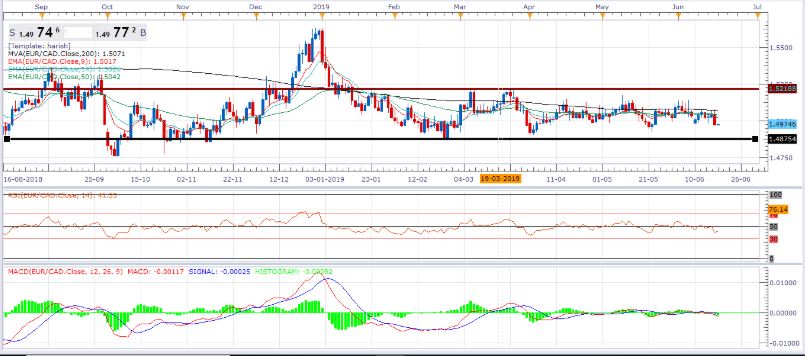
By looking at the daily chart we can see that Crude oil is falling down and making successively lower lows and lower highs. The first look of the chart is showing that bears have taken the charge and heading south side. The way it is falling down it seems like it’s just a starting further rally is still awaited. The downtrend line has been breached out which is supporting the bears.
From past couple of days we can see that bulls are losing their control from the game and bears are entering with fresh energy. From technical prospective we can see that a downtrend line has been breached out which is indicating that it’s time to short the pair.
From starting of the week we have seen an evening star candlestick followed by a two consecutive bearish marabuzo candlesticks which are indicating purely bearish signal and providing strength to the bears. Currently pair is trading and sustaining below minor n major moving average lines.
Black gold has given clear indication of bearish momentum and we will get further confirmation once we see a daily closing below the $55 level. Presently bears are notching over the bulls as we can see that they stopped the bulls to move further upside and pulling the crude oil to south side. Well intermediate term trend is down and we got further weakness due to valid breakout of the uptrend line.
Investors and traders are advised to short the crude oil at current level $56 and further add short positions till $58 for the target of $53 and $50 with the tight stop loss of $58.70.
From technical prospective we can see that on the hourly chart a rounding top pattern has been completed successfully by the bears. Most of the indicators and oscillators are signaling bearish and waiting for the further bearish momentum. Odds are in favor of bears and daily to weekly bias remains bearish on the pair. A bearish crossover on MACD indicator is also favoring the bears.
Bearish divergence on RSI
RSI is also favoring the bears for the time being. A bearish divergence on RSI is the recent development on the daily chart. The $58 level is immediate resistance level followed by $60 whereas $52 level is strong key support level followed by $50 level.


