
Real time, USDCAD Chart Key Levels
Forex trading can be unpredictable, however; it is important to understanding how to identify specific key levels in the market where price historically rejects or bounces. Astute traders recognized these supply or demand zones areas and stay ahead of the game. The implementation of these principles identifying various assets currency class where the price action dictates a set turning zone in the market. When Price reaches a certain resistance point key level where the Sellers take control ie called Supply zone whereby driving price back down. The complete opposite of the spectrum where price historically reach a certain down trend rejection point or support key technical or psychological level which may be identified as a Demand Zone where the buyers step in and drive price back up.
Our Technical Analysis of the weekly USDCAD Key levels are opinion based synopsis and may provide Traders possible insight into Support and Resistance zones.
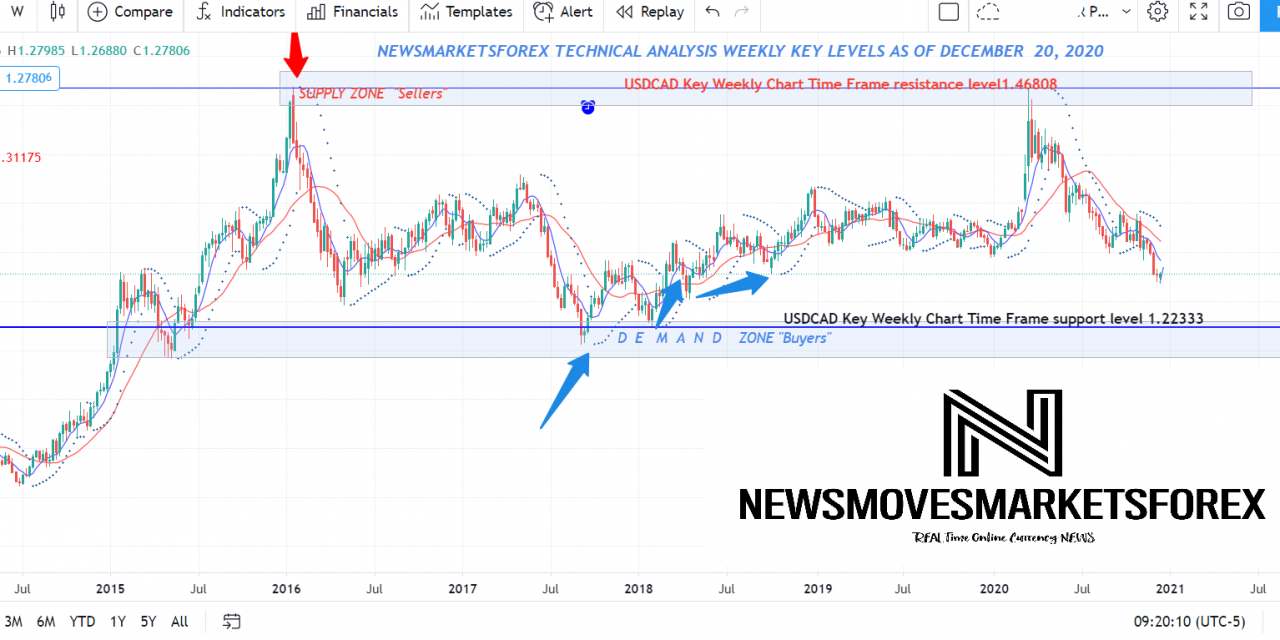
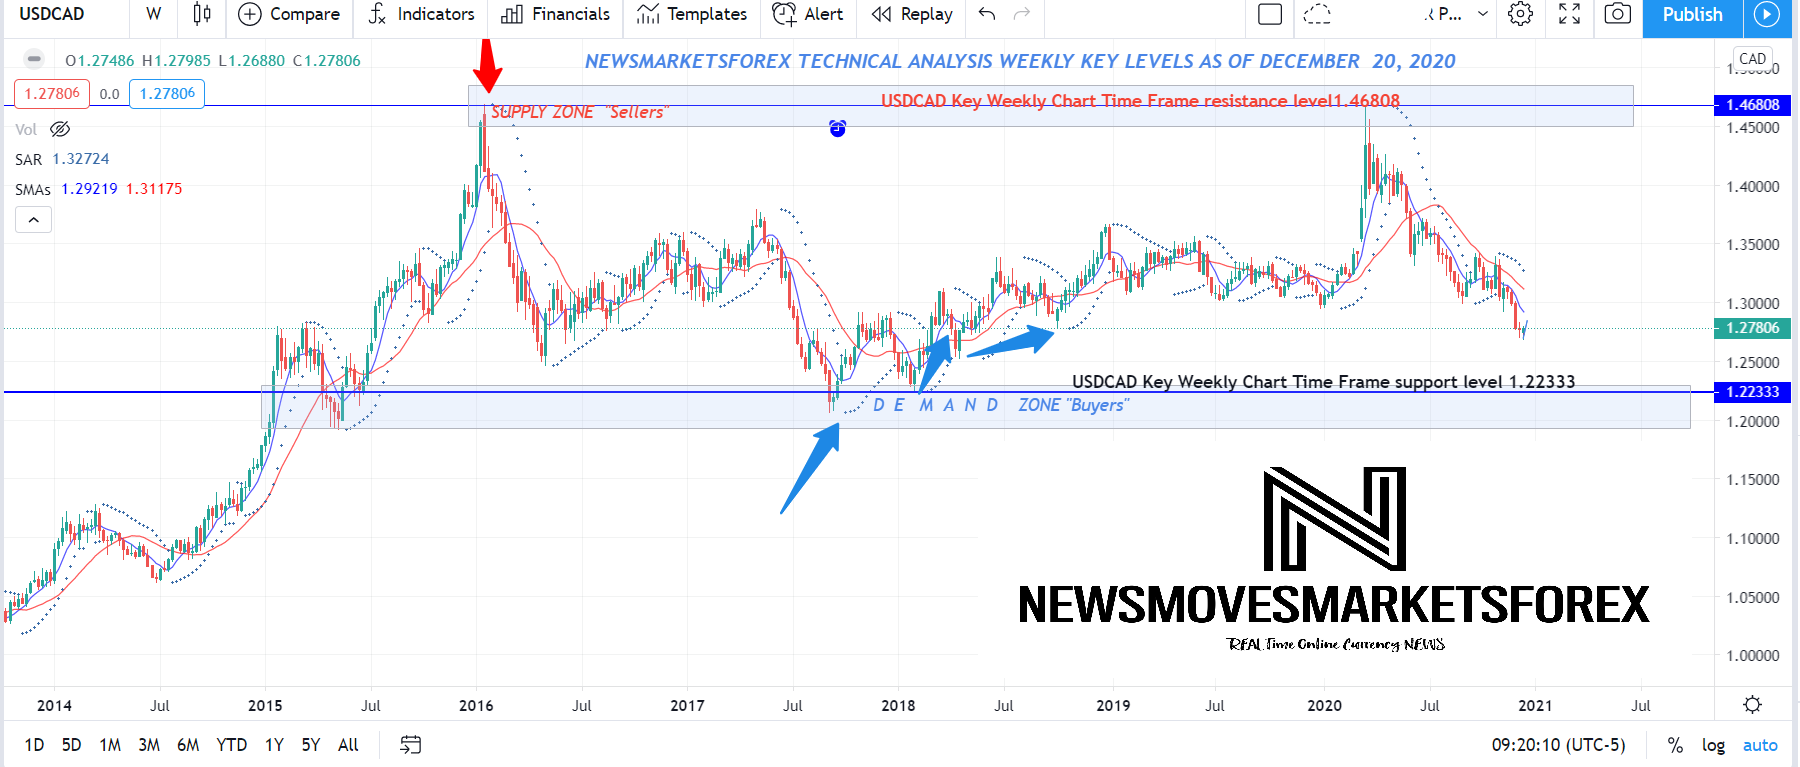
UsdCad Weekly Chart Key Levels Analysis December 20, 2020
UsdCad Weekly chart Resistance Key level 1.4680
UsdCad Weekly chart Support Key level 1.22333
 |
